
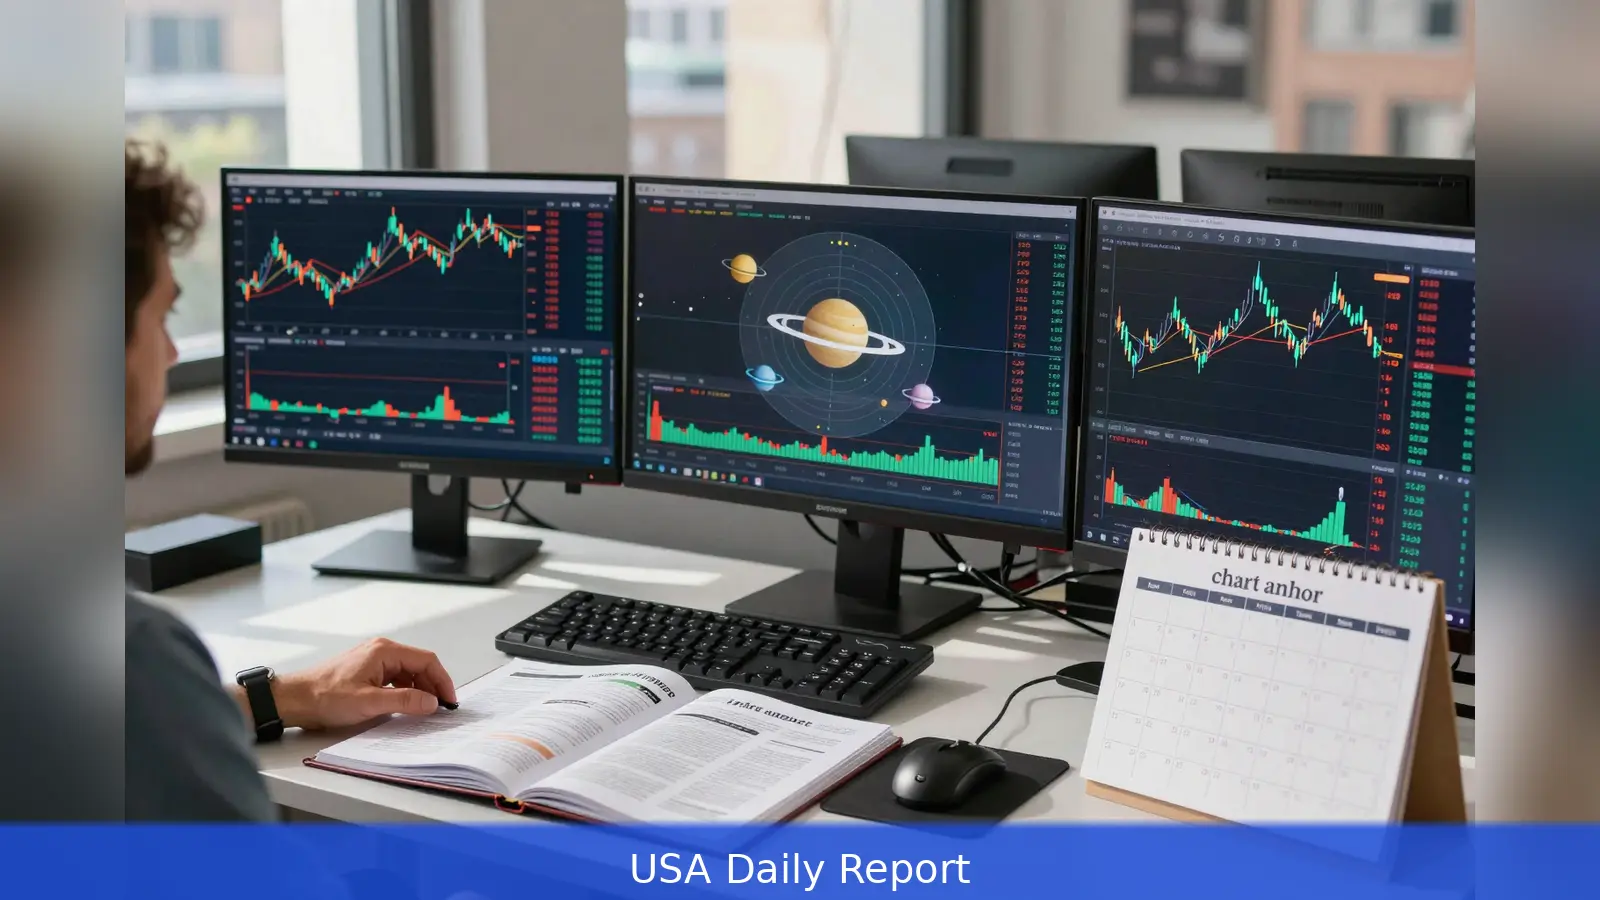
Some traders dismiss financial astrology as arcane lore, while the most used implementations run on databases with more than 15,000 first-trade charts and 18,300 company records and behave like standard quant systems. This guide explains how to build a repeatable planetary market calendar for U.S. stocks, ETFs, commodities and other instruments, combining precise ephemerides, lunation listings and company or first-trade charts with deterministic timing rules. It lays out the data you need, which chart anchors practitioners use, InvestByCycles’ intraday and daily orb windows to apply, how to backtest outcomes and how to turn a tested rule set into live alerts. Start by picking a chart anchor and a daily transit source, then run a systematic backtest that applies InvestByCycles’ windows to your historical price series.
Some traders anchor market timing to a company's founding time, while others favor the listing's first-trade moment or a CEO's natal chart.
1. Define scope and source the data
The first decision is simple and decisive: what instruments will you time. Pick a bounded universe: U.S. equities and ETFs, major commodity futures, a basket of forex pairs or a crypto set. Commercial services exist to shortcut the heavy lifting. For example, AstroApp’s Financial Edition advertises coverage that includes more than 15,000 first-trade charts, a database of 18,300+ companies across multiple markets, end-of-day and intra-day price streams for major exchanges and extended datasets for forex and cryptocurrencies. That kind of bundled coverage saves you the work of matching symbols to corporate metadata.
Whatever supplier you pick, make sure your dataset contains two distinct feeds. First, precise astronomical inputs: planetary ephemerides, daily lunar phases and eclipses, planetary ingress dates and stations. Second, market data: complete price histories, intraday feeds if you plan to trade intraday, and corporate metadata such as listing dates, incorporation timestamps and exchange identifiers. If you assemble your own sources, treat the ephemeris as a versioned asset so you can reproduce tests later.
2. Map market entities to charts and set a standard
There are three common chart anchors in market astrology: the instrument's first-trade or listing time, the corporate incorporation or founding time, and personal natal charts for key executives when users think leadership matters. AstroApp specifically lists a built-in database of first-trade horoscopes for U.S. markets and multiple international exchanges, plus incorporation horoscopes for selected jurisdictions. Pick one anchor per instrument and document it.
Handle missing or fuzzy timestamps with a documented fallback rule so your results are reproducible. A practical fallback is to use the official market open time on the listing date when minute-level times are unavailable. Write that rule into your data policy and apply it consistently in both backtests and live signals.
3. Choose timing rules, aspect sets and orbital windows
Translate astrological concepts into deterministic windows you can code and test. InvestByCycles publishes a practical working standard for intraday and daily timing that many practitioners adopt. Use these specific windows as a starting point: Moon, within a 12-hour applying orb and within 6 hours separating after the trading day; Sun, roughly 24 hours and the day of market open; Mercury, within 24 hours and day of market open except at stations; Venus, about 24 to 36 hours and day of market open; Mars and outer planets, typically 4 to 5 days applying and 1 day separating relative to market open. Larger slow cycles such as Jupiter, Saturn, Uranus, Neptune and Pluto and long-term nodes are treated as multi-day to multi-month layers and typically map to regime shifts rather than sharp intraday turns.
Decide which aspects will populate your calendar: exact conjunctions, oppositions, squares, trines, sextiles, retrograde stations, lunations, eclipses, planetary ingresses into cardinal signs and selected heliocentric configurations. Many practitioners combine geocentric cycles for sentiment moves with heliocentric cycles for transformational events. Methodological frameworks such as A Trader’s Guide to Financial Astrology by Larry Pesavento and Shane Smoleny outline which patterns historically correlate with turning points and how to translate solar and lunar harmonics into timing probabilities. Use that guidance to choose a working set of aspects you will test.
4. Build and backtest a historical market dataset
Build tests with the same anchor and price series you intend to operate with live. Where available, commercial databases link first-trade charts to market symbols and provide long historical series. Create event windows around each astrological occurrence using the orb conventions you selected.
Define clear metrics before you run tests. Track frequency of signal occurrence, conditional return distributions across fixed forward windows such as intraday, one day and five days, hit rates for directional bias and risk-adjusted measures like Sharpe or Sortino ratios. Pesavento and Smoleny emphasize converting planetary patterns into measurable probabilities rather than deterministic forecasts, and they describe ways to combine timing with technical rules and Gann-based time geometry in test campaigns. Treat every astro event as a probabilistic signal that must be measured against null behavior.
5. Integrate technical, fundamental and risk overlays
Financial astrology operates best as a timing overlay, not a standalone engine. Practitioners caution that planets correlate with market behavior but do not "cause" prices, so astro-timed cues should be combined with conventional analysis and strict risk controls. Use technical filters to qualify astro signals: for example, act only when an astro timing window coincides with a support or resistance test, a moving-average trend confirmation or a breakout on volume.

Embed explicit risk rules. Define stop-loss distances, position-sizing protocols, maximum exposure per theme or sector and rules that prevent overtrading during high-frequency lunar activity. Document each rule so your backtests are auditable and so live behavior can be replayed against historical simulations.
6. Translate backtests into a live calendar and alert system
Decide the calendar granularity and delivery format that fit your timeframe and operational capacity: a daily digest of multi-day regimes, an intraday alert feed for Moon and fast-moving planetary contacts, or push notifications tied to exact aspect times. Many practitioners recommend keeping a planetary diary, for instance using Llewellyn’s Daily Planetary Guide to track the whole picture, and annotating daily market notes to reveal context and pattern persistence.
Put in place a tagging system for each event that records the type of event, the anchor chart used, the applied orb at market open and a probability weight derived from backtests. For intraday trading, set pre-market alerts for Moon and Sun windows and prioritize cross-market events such as eclipses and outer-planet conjunctions, which historically align with broader volatility episodes.
7. Account for asset-class differences and special instruments
Different asset classes often react differently to the same astrological signals. Practitioners note that crypto’s speculative behavior often yields higher sensitivity to certain planetary configurations, while commodities may align more strongly with planetary rulers associated with physical resources. Test each asset class separately and retain class-specific orb widths and aspect weightings.
For ETFs and indices, decide whether to time the index fund first-trade chart or to aggregate signals from constituent large-cap issuers. Both approaches are defensible. Document your choice and run separate backtests for index-level timing and constituent-based timing to see which produces more robust edges for your objective.
8. Select implementation tools and learning resources
Commercial software like AstroApp supplies pre-built first-trade chart collections, technical indicator overlays, astro indicators, portfolio features and event profitability analysis, along with the ability to combine technical indicators with astro events. Books and manuals such as A Trader’s Guide to Financial Astrology supply the methodological backbone for converting celestial geometry into testable timing hypotheses. For day-to-day ephemerides and transit listings, InvestByCycles and Llewellyn’s Daily Planetary Guide are commonly used by practitioners for compiling a usable daily diary.
Pick tools that let you export event lists, tag events and integrate with your execution or alerting channels. Treat the software configuration and any manual chart-time edits as versioned items so you can reproduce historical views exactly.
9. Maintain governance, recordkeeping and continuous improvement
Log every trade you take against astro-calendar triggers and store event metadata and market context. Review performance at set intervals, for example quarterly. Retest your timing rules after structural market changes. Preserve reproducibility by versioning your ephemeris source, software settings and any manual adjustments to chart times. A governance discipline makes the difference between an anecdotal planetary diary and a repeatable timing system.
Finally, one concrete next step that multiple practitioners name: select a chart anchor and a transit source, such as a commercial first-trade and incorporation chart database together with a daily transit guide like Llewellyn’s Daily Planetary Guide, then run a systematic backtest that applies InvestByCycles’ intraday and daily orb windows to your historical price series. That single experiment will show you where the timing signal produces measurable probabilities and where it fails.
In Short
First, choose your universe and a data provider with both ephemerides and market histories, for example AstroApp.
Second, pick a single chart anchor per instrument and document a fallback rule for missing times.
Third, apply InvestByCycles’ orb windows and a selected set of aspects, then measure frequency, forward returns and risk-adjusted metrics.
Fourth, qualify astro signals with technical filters and explicit risk controls before going live.
Fifth, log every trade, version your ephemeris, review quarterly and iterate.
Related Articles
- Best VPN Routers 2026: 3 Paths, One Verdict
- 10-step guide to choosing an FFmpeg REST API in 2026
- Faceless YouTube Channel: 9 Steps to Build Income with AI
Pick a chart anchor and a transit source, for example a commercial first-trade and incorporation chart database paired with Llewellyn’s Daily Planetary Guide, then run a systematic backtest that applies InvestByCycles’ intraday and daily orb windows to your historical price series. That single experiment will reveal where the timing signal offers measurable probabilities and where it does not.
This article was created with AI assistance.


