Wondering how much income tax the U.S. collects each year? The short answer is: it’s in the trillions. The federal government pulls in most tax revenue from individual income taxes and payroll taxes. Here are the key numbers from the latest full year, along with what’s included, how receipts have shifted, differences among states, and a brief look ahead to 2026.
Key figures — quick reference
- Total federal tax collections (all types) — $5.1 trillion (calendar/fiscal 2024, most recent full-year baseline).
- Individual (personal) income tax receipts — about $2.45 trillion (roughly 48% of total federal receipts, 2024).
- Payroll taxes (Social Security & Medicare) — about $1.63 trillion (roughly 32%, 2024).
- Corporate income tax receipts — about $360 billion (roughly 7%, 2024).
- Other receipts (excise, estate, customs, fees) — about $660 billion (roughly 13%, 2024).
- State and local tax collections combined — $1.47 trillion in 2024 (state income taxes are only part of this total).
- Per capita federal tax burden (2024) — roughly $15,200 per U.S. Resident (population ≈335 million).
- Estimated number of individual income tax returns filed — ~160 million returns (recent filing years).
- Average federal individual income tax per filer — roughly $15,700 (computed from receipts / filer count, 2024).
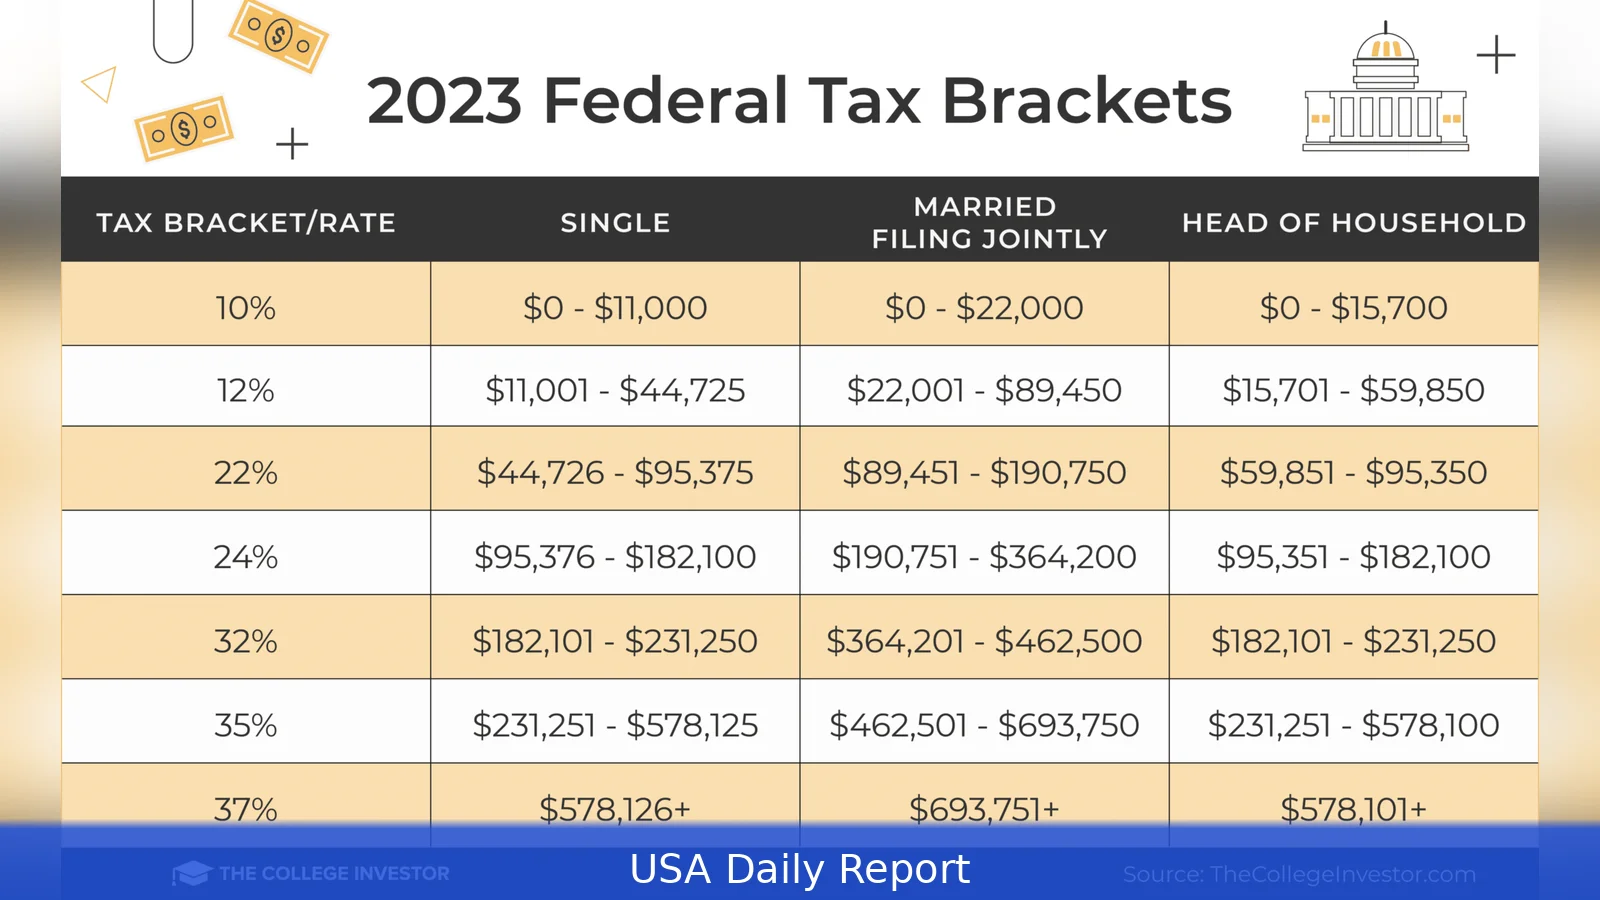
- Top statutory federal individual income tax rate — 37% (current top marginal rate since 2018).
- Federal corporate statutory rate — 21% (since 2018).
- Payroll tax rates — Social Security 12.4% (split 6.2% employer/6.2% employee up to the wage base), Medicare 2.9% (split 1.45%/1.45%) plus 0.9% additional Medicare tax on high earners.
Detailed breakdown — what those dollars represent
When people ask how much income tax the U.S. Collects, they often mean just individual income tax. But the federal government’s tax intake includes several categories. Using 2024 as the most recent full-year baseline, here’s a clear breakdown in dollars and share of total receipts.
- Individual income taxes — $2.45 trillion (≈48% of federal receipts). This is the largest single slice. It includes withholding, estimated payments and tax paid at filing.
- Payroll taxes — $1.63 trillion (≈32%). These fund Social Security and Medicare trust funds and are withheld from paychecks. Employers match most of the worker share.
- Corporate income taxes — $360 billion (≈7%). Corporate receipts have varied widely year to year — they fell in some pandemic years and rebounded later.
- Other federal receipts — $660 billion (≈13%). This includes excise taxes, customs duties, estate and gift taxes, fees, and miscellaneous receipts.
To put it simply, individual and corporate income taxes make up about 55% of federal receipts, with payroll taxes adding roughly another third.
How that compares to state and local collections
The federal government collects far more in total taxes than state and local governments combined. In 2024 state and local governments collected about $1.47 trillion in tax revenue — meaning federal collections were roughly 3.5 times larger. State revenue comes from income taxes (in many states), sales taxes, property taxes, and local fees.
Per-person and per-filer math
Here are useful numbers to keep in your back pocket:
- Per capita federal receipts (2024): ≈ $15,200 per person (total $5.1T / U.S. Population ≈335M).
- Average individual income tax per filer (2024): ≈ $15,700 (personal income tax receipts / ~160M returns).
- Median household federal income tax burden is much lower than averages, because income and taxes are skewed at the top.
Tax rates and rules that drive collections
Tax collections depend on the rates set by law and how big the tax base is—things like income, wages, and corporate profits. Here are some key facts:
- Individual federal income tax: marginal rates currently top out at 37% for the highest brackets. Bracket thresholds are adjusted annually for inflation.
- Payroll taxes: Social Security’s combined rate is 12.4% (6.2% employee + 6.2% employer) up to the annual wage base; Medicare is 2.9% combined, with an extra 0.9% Medicare surtax for high earners.
- Corporate rate: flat 21% statutory rate (post-2017 tax law).
- Capital gains: lower preferential tax rates for long-term capital gains and qualified dividends — commonly 0%, 15% or 20% depending on income — so these affect total individual income tax receipts significantly.
Year-to-year change and drivers
Income tax receipts tend to rise and fall with wages, employment levels, corporate profits, and changes in tax laws. A few numbers to show the trend:
- Total federal receipts rose from the low-trillions a decade ago to over $5 trillion in 2024.
- Individual income tax receipts increased as wages and realized capital gains rose in later years — large gains years push receipts upward.
- Payroll tax receipts track employment and wages — they fell in job-loss years and rose when payrolls recover.
- Corporate receipts are volatile: they can swing hundreds of billions depending on profit cycles and deductions.
Common mistakes to avoid when interpreting these numbers
People often mix up terms. A few quick clarifications:
- “Income tax” often means federal individual income tax — but total federal collections include payroll and corporate taxes too.
- Per-capita figures divide by the entire population — they’re not the same as average tax paid per filer or per household.
- Receipts aren't “what government spends” — the federal government borrows to cover deficits when spending exceeds receipts.
- Year labels: fiscal years (FY) run Oct. 1–Sept. 30; calendar-year reporting can differ. Always check which year’s frame is used when comparing figures.
Regional differences
Federal income tax dollars aren't collected evenly across states. Higher-income states generate more federal income tax receipts in total:
- High-population, high-income states like California and New York contribute the largest shares of federal income tax dollars — California taxpayers paid over $800 billion to the federal government in recent years and New York contributed hundreds of billions.
- Per-capita federal tax contributions tend to be higher in high-wage states and lower in lower-income states.
- State tax systems vary: 10 states have no broad-based personal income tax, so residents there still pay federal income tax but pay less at the state level.
Step-by-step: how the government collects most income tax dollars
- Employers withhold federal income tax and payroll taxes from paychecks throughout the year.
- Self-employed workers make quarterly estimated tax payments for income and self-employment (payroll-equivalent) taxes.
- Individuals and businesses file annual returns — IRS reconciles withholding, credits, and additional tax owed or refund due.
- Taxes paid during the year plus payments with returns become final receipts recorded in Treasury accounts for the fiscal year.
2026 outlook — what to expect
That said, for 2026, modest growth in collections is likely barring large tax-law changes. Key expectations:
- Federal receipts should grow with wages and inflation adjustments to brackets — a modest single-digit increase year-over-year is typical in normal times.
- If capital markets stay strong and corporate profits hold up, individual and corporate income tax receipts could rise meaningfully.
- Projected range for total federal receipts in 2026: low-to-mid single-digit growth from the 2024 baseline of $5.1 trillion — implying roughly $5.2–$5.5 trillion, depending on the economy and filings.
Alternatives and comparisons
Comparing the U.S. To itself over time is often more useful than international comparisons because tax bases and systems differ. Still:
- The U.S. Relies heavily on individual income and payroll taxes. Other countries rely more on VAT/sales taxes.
- State-level tax systems can shift total tax burdens — a resident in a no-income-tax state still pays federal income tax and payroll tax.
Related Articles
- How much is federal income tax in Texas, 2026
- Chicago average rent increase 2026
- Section 8 Housing 2026 Application Guide
The United States collects roughly $5.1 trillion in federal tax revenue in the most recent full year (2024), with individual income taxes making up nearly half of that total. Payroll taxes add another third. Collections move with wages, employment and profits—so receipts and the share from each tax category change every year. Expect modest growth in 2026 unless major law or economic shifts occur.


