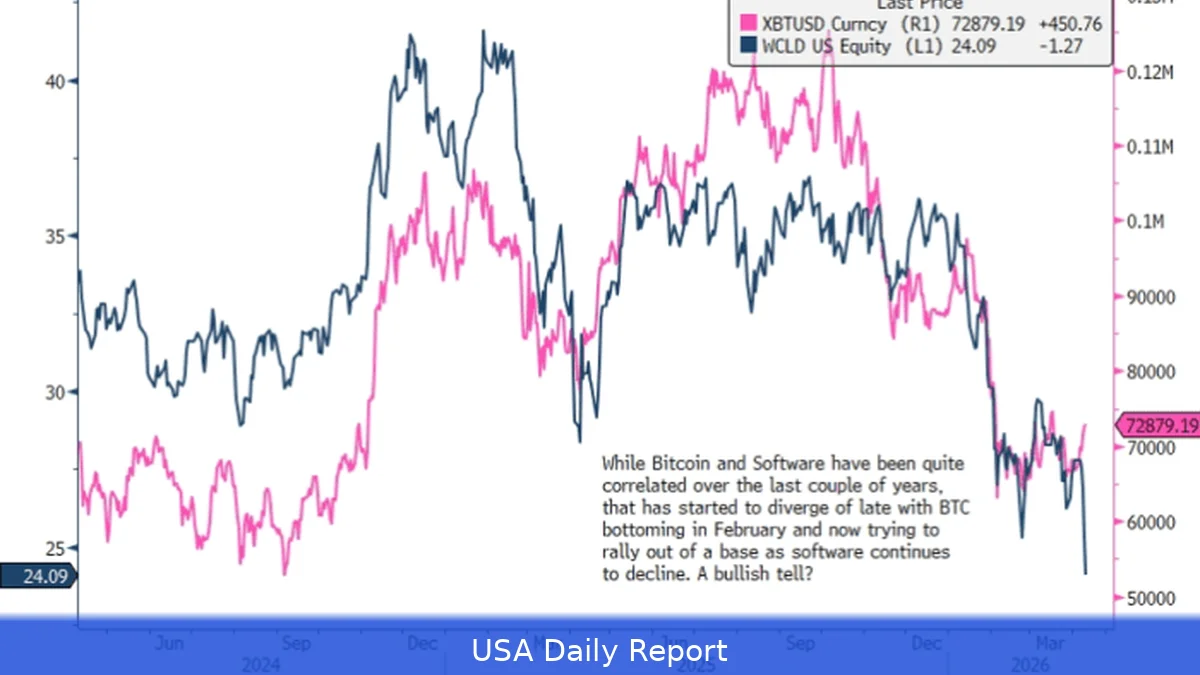
Software stocks are getting pummeled alongside broad tech weakness. Bitcoin’s recent rebound, though, is flashing some early signs that a market low could be taking shape.
Market shock: tech pain spreads to software names
Tech indexes dropped this quarter, and many software stocks fell sharply as investors moved away from high-growth names.
The Nasdaq-100’s pullback sets the stage, and Bitcoin has been moving alongside it.
This close link matters since crypto traders often see Bitcoin as a high-risk tech asset. When equities dip, Bitcoin usually falls harder than it rises when equities bounce back.
Wintermute’s Jasper de Maere warned about that asymmetric behavior in a blog post — he said Bitcoin falls harder on bad equity days than it rises on good ones, a pattern the firm has seen near market bottoms.
Long-term holders are shifting — and that’s a warning
Bitcoin’s internal data is flashing some early warning signs.
Community analyst Maartunn pointed to steady selling from long-term holders and early whales, activity that turned up on the Coin Days Destroyed indicator as older coins moved or were spent.
Those moves have coincided with ETF outflows, which means demand softened just as supply rose. That combination increases downside pressure, not the other way around.
The 50-week moving average has also been a problem. BTC didn’t bounce off that long-term support this cycle the way it did in earlier recoveries, and that failure makes people wonder about the durability of the rally.
But there are bullish signals too
But not all indicators are negative.
A different batch of indicators is suggesting accumulation and oversold conditions that have preceded past rebounds.
Analyst AO shared a macro model using a Stochastic RSI applied to the product of the U.S. And China 10-year bond yields — US10Y times CN10Y — and noted bullish crossovers from oversold levels often showed up near major BTC bottoms. Crypto Rand called the March crossover “extremely precise” and said the signal implies a strong upside pushed back into play.
Onchain data from CryptoQuant and wallet-level balances support that view: addresses holding between 1,000 and 10,000 BTC resumed adding to their holdings during recent price weakness, behavior that mirrored accumulation before prior bull runs.
Key technical levels and what they imply
Bitcoin’s weekly charts give a mixed read.
The 100-week simple moving average has held as a defensive line in recent tests; bears have failed to force a decisive breakdown beneath it, which has been a reliable bottom marker in past cycles.
At the same time, BTC’s relative strength index slipped into oversold territory below 30 on the weekly frame, which historically raises the odds of at least a relief bounce. Traders point to the 200-week moving average as the deeper safety net.
That’s why some analysts are mapping a path back toward the $100,000 zone: a decisive rebound off the 200-week or a reclaim of the 50-week SMA could funnel momentum toward the $100,000 target where moving averages and Fibonacci resistance converge.
Where support and resistance sit now
Several analysts have pinned specific price bands to watch.
Axel Adler, an analyst who’s been tracking the current pullback, flagged $106,000–$107,000 as a core support range; if that fails, he said a retest of $100,000 — and the yearly moving average there — becomes more likely.
Conversely, a break above the $78,000 resistance would be a bullish check for some traders, though others warn that move could also turn into a bull trap if BTC can’t follow with broader strength.
Onchain signs: who’s buying, who’s selling
Not all holders are acting the same.
Glassnode’s flow metrics and CryptoQuant’s whale-balance charts showed renewed accumulation among small and mid-sized wallets since early October even as prices fell from about $118,000 to near $108,000.
Stockmoney Lizards highlighted Bitcoin’s MVRV Z-Score at roughly 2.15, a zone they associate with accumulation rather than speculative euphoria, and argued that smart money was buying into the slide.
At the other end, long-term holders and some early whales appear to be trimming positions — the very activity that lit up Coin Days Destroyed and rattled traders in recent weeks.
How traders could reconcile the split signals
Traders now face competing narratives. One says distribution by older holders plus asymmetric equity correlation points to exhaustion and more downside. The other points to oversold technicals, whale accumulation in specific cohorts, and historical macro crossovers that preceded big recoveries.
Right now, the market is testing both stories simultaneously.
This situation offers tight trading chances for short-term players but makes risk-reward tricky for long-term investors. If key supports hold, the stage is set for a fast squeeze higher. If they don’t, the path to lower yearly averages opens up.
Why software stocks and crypto move together
Bitcoin’s connection to the Nasdaq-100 partly explains why software stocks have taken a hit. Large indexes dominated by growth and software companies can amplify moves in risk appetite, and crypto tends to exaggerate the same swings.
So when investors sell pricey software stocks, crypto often drops too—and it can bounce back when appetite returns.
That connection means macro moves — rate expectations, bond yields, big equity rotations — matter for both corners of the market at once.
What to watch next
Keep an eye on a handful of concrete, market-moving items.
First: net flows into and out of spot Bitcoin ETFs. Outflows coincided with recent weakness and add supply-side pressure.
Second: whether BTC can reclaim the 50-week moving average and push through the $78,000 resistance level. Traders see that as a short-term proof point for renewed momentum.
Third: policy and yield moves in the U.S. And China, given the macro model that overlays bond yields with Bitcoin momentum. If yields shift dramatically, the model’s signal could change quickly.
Related Articles
- The New York Times Points to British Cryptographer as Bitcoin’s Mysterious Creator
- UnitedHealth Jumps After CMS Boosts Medicare Advantage Rates; BofA Raises Price Target
- Franklin Templeton Takes a Major Step into Crypto with New XRP ETF
Analyst Axel Adler identified $106,000–$107,000 as key support — losing it could trigger a retest of $100,000.


